


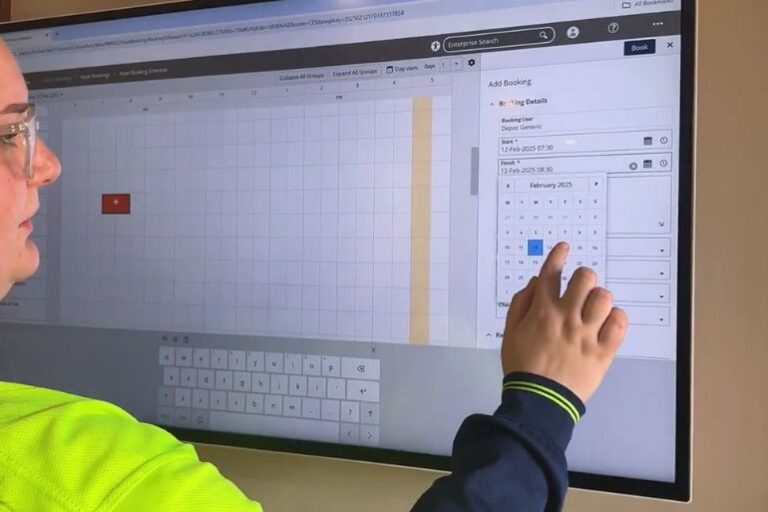
Fleet performance cannot be improved if it is not being measured.
For the three finalists in the 2026 Fleet News Group Fleet of the Year Award — Blacktown City Council, Ausgrid and Parkes Shire Council — dashboards, telematics and structured reporting are becoming central to the way fleet teams monitor performance and identify opportunities for continuous improvement.
The three organisations operate very different fleets, but each has developed systems to turn fleet data into management information.
Blacktown City Council tailors dashboards to different operational teams. Ausgrid uses Power BI and SAP to provide reporting from the driver level through to senior executives. Parkes Shire Council has developed detailed TechnologyOne dashboards covering availability, recovery rates, operating costs, maintenance and utilisation.
The common theme is that fleet reporting is not being produced simply because data is available. It is being used to change decisions and improve performance.

Blacktown City Council: different dashboards for different managers
Blacktown City Council collects operational information through telematics and other fleet systems covering utilisation, downtime, speeding and driver behaviour.
Rather than providing the same report to everyone, the City Fleet team tailors dashboards to the requirements of individual business units.
A waste manager, for example, may need to see downtime and vehicle activity every day because an unavailable truck can have an immediate effect on service delivery.
Other areas, such as parks and green spaces, may only require monthly reporting focused on utilisation and driver behaviour.
The underlying data is available daily, with formal reporting produced weekly or monthly depending on the operational need.
This makes the reporting more useful because managers receive information that is relevant to their responsibilities rather than a generic fleet report.
The council is also using utilisation data to support broader asset decisions.
Vehicles can be rotated between departments where data identifies periods of underutilisation, while replacement decisions are increasingly based on duty cycle and actual usage rather than age alone.
Blacktown has also standardised some vehicle bodies so assets can be more easily transferred between operating groups.
Measuring maintenance improvement
One of Blacktown’s most visible continuous improvement measures is its heavy vehicle defect performance.
The council introduced more structured preventative maintenance, including a 13-week maintenance cycle and regular mechanical inspections for high-use heavy vehicles.
According to the fleet team, daily defect reporting that previously ran to around 17 pages had fallen to approximately six or seven individual items by the time of the Awards interview.
That result provides the team with evidence that its move from reactive to proactive maintenance is producing an operational benefit.
Driver behaviour is another area being monitored.
Speeding, parking infringements and other information can be reported to employees and their managers, while work-vehicle behaviour can be addressed where it becomes a workplace issue.
The reporting is primarily used internally for management and coaching rather than being routinely published to elected members or the public.

Ausgrid: reporting from the driver to the CEO
Ausgrid also uses layered reporting. SAP provides the organisation’s principal source of fleet and asset information, while maintenance data, telematics and other systems feed into Power BI dashboards.
At senior management level, reporting can be deliberately simple. During the finalist interview, Ausgrid explained that the CEO-level view focuses on whether the fleet is safe, compliant and on track.
Executives can see a high-level summary and then drill into more detailed information when required.
That approach recognises that senior leaders do not necessarily need every operational metric. They need enough information to understand whether fleet risks, performance and strategic objectives are being managed.
At the fleet level, much more detailed information is available covering maintenance, asset history, fuel, incidents and driver behaviour.
Driver performance is becoming a leading indicator
Ausgrid is increasingly using telematics information as a leading indicator for safety.
Drivers can see their own performance through dashboards, while reports are also provided to supervisors.
Information such as speeding and harsh braking contributes to driver performance scores.
Employees with the poorest results may receive a letter signed by the CEO, reinforcing that driver safety has senior management visibility.
The fleet team is also developing more targeted, risk-based training so resources can be directed towards employees presenting higher risk rather than providing identical training to the entire workforce.
Ausgrid has also discussed plans to gamify driver performance across depots, allowing teams to compare results and work collectively towards improved safety scores.
This creates a direct connection between measurement, reporting and behavioural change.
Digital systems also support maintenance improvement
Ausgrid uses digital maintenance systems that can be updated when a new issue or safety learning is identified.
If a maintenance requirement changes, the digital service documentation can be amended so the next technician opening the service sheet receives the latest information.
That means continuous improvement can move quickly from a lesson identified in the field to a change in the maintenance process.
Automated reporting can also identify unusual transactions or operating activity.
The fleet team gave the example of a fuel transaction that exceeds the capacity of a vehicle’s fuel tank. Rather than relying on someone noticing the anomaly later, the system can flag it for investigation.
Parkes Shire Council: measuring down to dollars per kilometre
Parkes Shire Council has developed some of the most detailed operational dashboards among the finalists.
TechnologyOne is used to monitor asset utilisation, recovery rates, operating costs and replacement performance.
The council has a target of 96 per cent fleet availability and uses dashboards to understand whether individual assets are meeting their expected financial and operational performance.
Its recovery dashboard uses a traffic-light system.
Green identifies assets performing strongly against their expected recovery position, orange highlights assets requiring attention and red identifies those significantly behind target.
This allows the fleet team to investigate why an asset is not performing. It may be underutilised, incorrectly charged, priced too low internally or no longer required.
Telematics can then be used as another check. If an asset has been moving but has not been charged to a job, the fleet team can investigate whether timesheets or internal cost allocation need correcting.
Reporting reaches executive management every month
Parkes provides major fleet reporting to the executive each month. This includes information relevant to different council funds and operating areas.
The council also distributes weekly fuel and vehicle reports to encourage more regular discussion at toolbox meetings and within operating teams.
The detail in the reporting allows Parkes to compare assets well beyond purchase price.
For some trucks, the fleet team calculates operating costs per kilometre, allowing different makes and models to be assessed on their actual whole-of-life performance.
That information is then used in future procurement and replacement decisions. It also gives the fleet team evidence when a department requests a new vehicle or piece of plant.
If utilisation and recovery data do not support replacement, the fleet team can explain why the asset may need to remain in service longer.
Continuous improvement measured in fuel, maintenance and utilisation
Parkes is also measuring specific improvement projects. Telematics showed around 750 hours of idling each week across approximately 150 monitored fleet assets.
After reporting the results and discussing them with operational teams, the council reduced that figure to around 500 hours per week.
Using its estimate of four litres of fuel consumed per idle hour, Parkes calculated that the reduction avoided roughly 1,000 litres of fuel use each week.
Reactive maintenance is another metric being monitored. During the interview, the fleet team showed data indicating reactive maintenance expenditure was declining as structured servicing and forward maintenance planning improved.
The council is also using fleet data outside traditional fleet reporting. Its telematics system can identify sharp G-force events that may indicate potholes, while auxiliary inputs allow the council to record when mower blades, street sweeper brooms and other equipment are actually operating.
This provides evidence of productive work rather than simply showing where a vehicle travelled.
Reporting should lead to action
The three finalists demonstrate that fleet reporting is most valuable when it leads to a decision.
Blacktown City Council is tailoring information to different managers and using utilisation and maintenance data to improve asset allocation and reliability.
Ausgrid is providing reporting from individual drivers through to the CEO, with telematics increasingly used to identify safety risks before an incident occurs.
Parkes Shire Council is combining operational, financial and telematics data to measure availability, utilisation, whole-of-life costs, idling and maintenance performance.
The systems are different, but the principle is the same.
Data creates visibility. Reporting creates accountability. Continuous improvement happens when organisations use that information to change what they do.
Have your say
Blacktown City Council, Ausgrid and Parkes Shire Council are finalists in the Fleet of the Year category in the 2026 Fleet News Group Awards.
Each organisation has demonstrated how fleet performance can be measured, reported and used to drive improvement.
Now it is up to the industry to decide which organisation is doing the best job.
Vote for the organisation you think deserves to be named Fleet of the Year.
The winner will be announced at the Fleet News Group Awards Night in Sydney on 14 October 2026. Fleet and automotive industry professionals can also register their interest to attend the event.